AiTown - aitown-dejavu
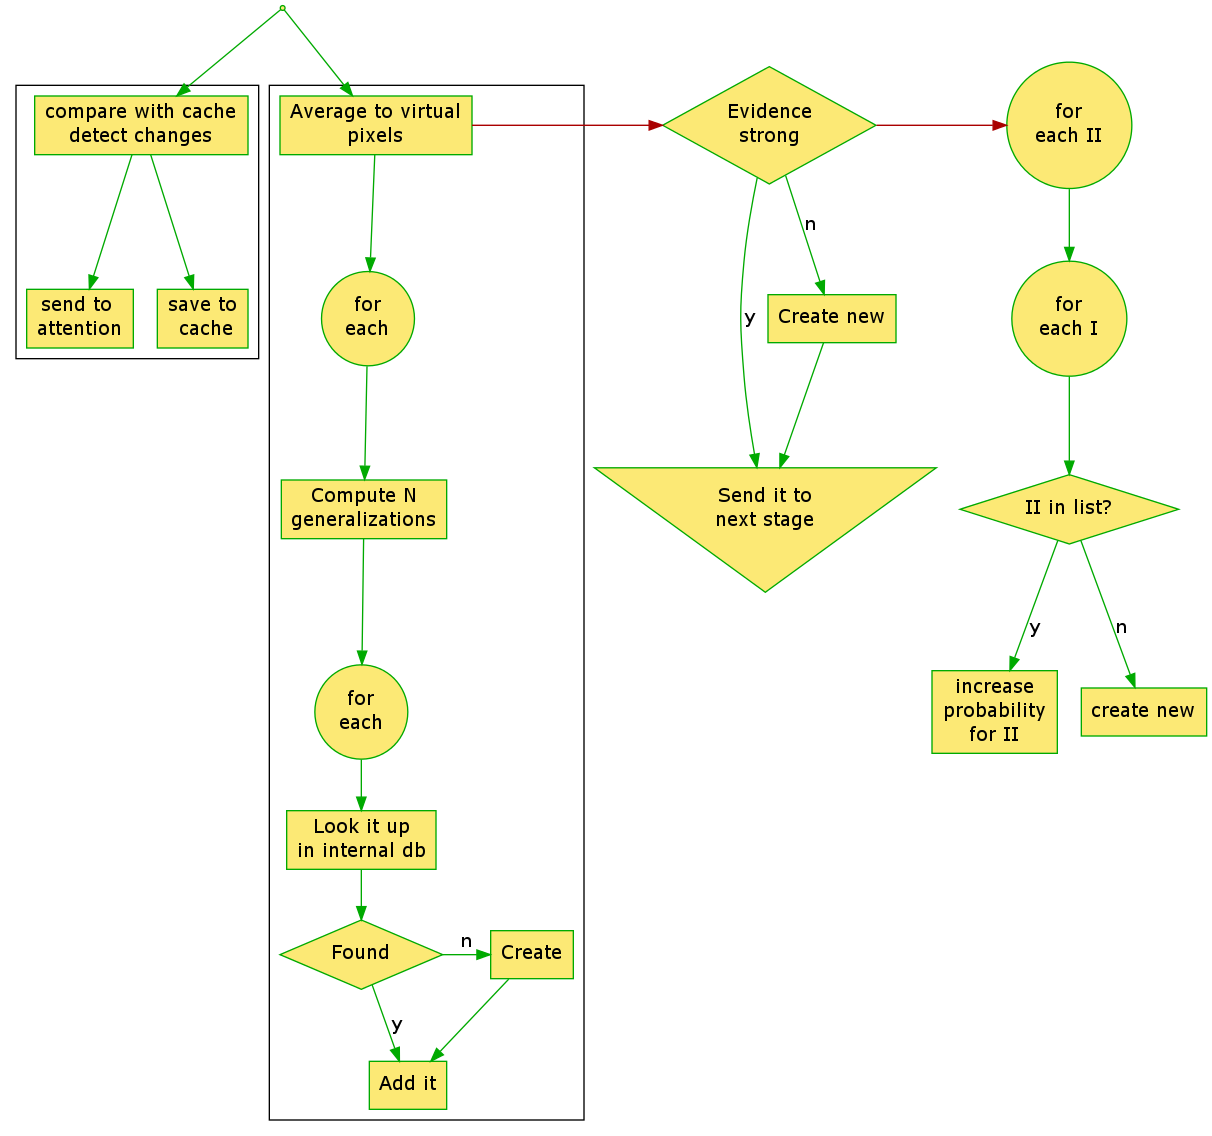
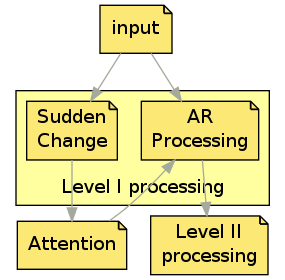
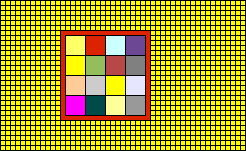
Initial input is being feeded to two logical processes: one that detects sudden changes in the entire picture and that is used to signal attention about interesting spots and one that processes the area of the image that is under attention right now. Theoretically, the two may be executed sequential or in paralel. Sudden changesEach time an input image arrives, it is compared with previous state to detect sudden changes. For this purpose the image is divided by a grid and the values for all pixels belonging to each cell of that grid are converted to something resembling grey (a single value for the three components - red, green, blue) and are averaged. Results what we call a grey "virtual pixel". The values computed in this manner are substracted from cached values from previous run. If a particular area has a high absolute difference compared with the differences from other cells or if a group of cells has a higher difference the atention is signaled to attend that area. The attention may decide to focus the attention rectangle to that area or not and this module will comply with that decision. The actual protocol for communicating with attention module is not defined, yet. Once the whole processing is over the averaged values are cached for the next run. Open questions:
Attention rectangle (\(\mathcal{AR}\))
The \(\mathcal{AR}\) is divided into a fixed number of rows and columns, resulting virtual pixels from averaging input pixels. Thus, if the \(\mathcal{AR}\) covers the entire image the resolution is worst and when it has minimum size (each virtual pixel coresponds to an input pixel) the resolution reaches maximum. For each virtual pixel a set of values is computed by dividing individual Red, Green and Blue components to increasingly higher values, starting with 1. These values are then used as keys in internal database and are reffered to as "Level I IDs". The internal database contains key-value pairs, with the key being an Level I ID and the value a list of entries for each position in the \(\mathcal{AR}\). Each such entry contains a list of Level II IDs and associated probability that Level II Id is observed when Level I ID was observed in that particular spot. The Level II IDs with comparativelly low probability are trimmed down after some time. The end result is that, for each virtual pixel, based on its position inside the \(\mathcal{AR}\), a list of Level II IDs is extracted. $$ (r, c, ID1_1) \to [ID2_1,p_1], [ID2_2,p_2], \cdots\\ (r, c, ID1_2) \to [ID2_1,p_1], [ID2_2,p_2], \cdots $$A set of Level II IDs is created and accumulates items as the Level I IDs are iterated and evidence gathers. The evidence is function of probability and is invers proportional to the level of generalization \(g\).
Once all evidence is gathered the list is evaluated to see if there is strong evidence for any Level II ID. If no item has a comparatively high probability a new Level II is created and assigned a high probability. The list created in this manner is send to Level II processing. The number of items may be limited and/or the items may be sorted either as the evidence gathers or at the end of the process. Once the probability for each Level II ID is established the list of Level I IDs is updated to reflect the findings in this run. $$ (r, c, ID1_1)[ID2_1] = \frac{prev_1 + norm(new_1)}{n+1} \\ (r, c, ID1_1)[ID2_2] = \frac{prev_2 + norm(new_2)}{n+1} $$Open questions:
|
|
|
Administrator: Nicu Tofan xtnickx@users.sourceforge.net github.com/TNick |